Is American democracy under threat? Bright Line Watch regularly asks political scientists and the public questions about democratic performance.
In their visualizations and reports, Bright Line Watch mostly focuses on measures of democratic performance to the degree that the US fulfills these standards.
In this little exercise, I want to focus on the measures that the US does NOT perform well on. Here I visualize the results.
Load neccesary Packages
# Install these packages if you don't have them yet
# if (!require("pacman")) install.packages("pacman")
# devtools::install_github("favstats/tidytemplate")

pacman::p_load(tidyverse, haven, tidytemplate)
Download Data
Data downloaded from Bright Line Watch homepage.
## Download Data
# download.file("http://brightlinewatch.org/wp-content/uploads/2018/11/BLW-Wave-7.zip", destfile = "data/blw_data7")

as.character(unzip("data/blw_data7", list = TRUE)$Name)
##  [1] "BLW_Expert_Waves1234567.csv"
##  [2] "BLW_Expert_Waves1234567.dta"
##  [3] "BLW_Expert_Waves1234567_nolabels.csv"
##  [4] "BLW_Public_Waves34567.dta"
##  [5] "BLW_wave34567_public.csv"
##  [6] "BLW_wave3456_public_nolabels.csv"
##  [7] "BLW_wave7_expert.csv"
##  [8] "BLW_wave7_expert.dta"
##  [9] "BLW_wave7_expert_nolabels.csv"
## [10] "BLW_wave7_public.csv"
## [11] "BLW_wave7_public.dta"
## [12] "BLW_wave7_public_nolabels.csv"
blw_expert <- read_dta(unzip("data/blw_data7", files = "BLW_Expert_Waves1234567.dta"))

# blw_expert %>% filter(wave == 6)
Expert Survey
Before I can visualize the survey, I clean and prepare the data:
n_experts <- blw_expert %>%
 filter(finished == 1) %>% nrow


blw_expert_viz <- blw_expert %>%
  select(wave, perf_misconduct:perf_investigations) %>%
  gather(key, value, -wave) %>%
  drop_na(value) %>%
  mutate(standard = ifelse(value == 1, "Missing Standard", "Anything Else")) %>%
  count(key, wave, standard) %>%
  group_by(wave, key) %>%
  mutate(total = sum(n)) %>%
  mutate(perc = n / total) %>%
  ungroup() %>%
  filter(standard == "Missing Standard")  %>%
  mutate(statements = case_when(
    key == "perf_ban_ideology" ~ "All parties allowed",
    key == "perf_candidates_disclose" ~ "Candidates disclose info",
    key == "perf_common_und" ~ "Common understanding of facts",
    key == "perf_compromise" ~ "Compromise sought",
    key == "perf_contributions" ~ "Contribs determine policy",
    key == "perf_districts" ~ "Districts not biased",
    key == "perf_election_fraud" ~ "Fraud-free elections",
    key == "perf_equal_rights" ~ "Equal political/legal rights",
    key == "perf_expand_executive" ~ "Constitution limits executive",
    key == "perf_foreign_influence" ~ "No foreign influence",
    key == "perf_funds_transparent" ~ "Campaign funds transparent",
    key == "perf_investigations" ~ "Investigations not compromised",
    key == "perf_journalists" ~ "No interference with press",
    key == "perf_judicial_ind" ~ "Judicial independence",
    key == "perf_judiciary_check" ~ "Judiciary can limit executive",
    key == "perf_legislature_check" ~ "Legislature can limit executive",
    key == "perf_misconduct" ~ "Sanctions for misconduct",
    key == "perf_monitor_opponents" ~ "Agencies not used against opp.",
    key == "perf_opinions" ~ "Opinions heard on policy",
    key == "perf_participation" ~ "Voter participation",
    key == "perf_patriotism" ~ "Patriotism not questioned",
    key == "perf_private_gain" ~ "No private gains from office",
    key == "perf_private_violence" ~ "No political violence",
    key == "perf_protest" ~ "Protest rights",
    key == "perf_votes_impact" ~ "Votes have equal impact",
    key == "perf_voting_rights" ~ "Equal voting rights",
    key == "perf_free_speech" ~ "Free speech",
    T ~ NA_character_
  )) %>%
  mutate(statements = forcats::fct_reorder(statements, perc))
## Warning: attributes are not identical across measure variables;
## they will be dropped
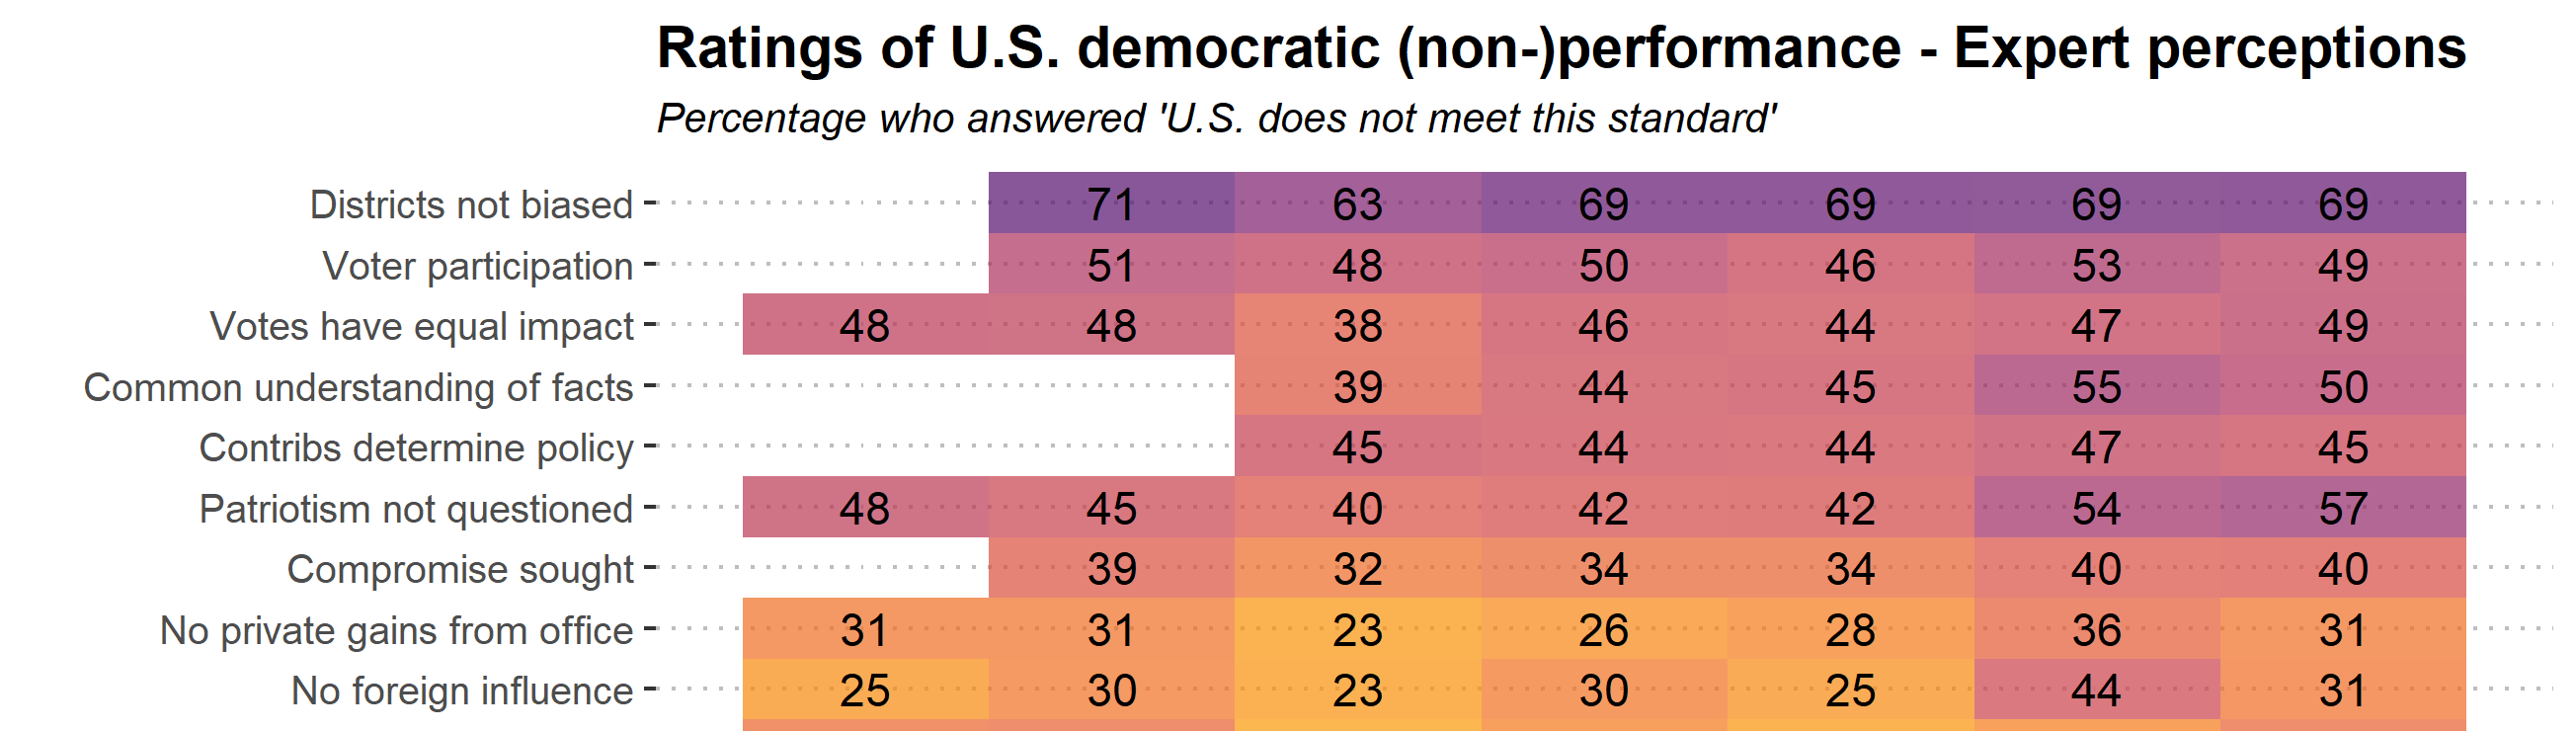
The data ranges from February 2017 to October 2018. For the purpose of this visualization, I took out 27 statements of democratic performance and show the percentage of experts that do not think the U.S. meets the necessary standard (a full list of statements can be found in the appendix).
Visualizing expert survey results now:
survey_dates <- c("Feb/17", "May/17", "Sep/17", "Jan/18", "Apr/18", "Jul/18", "Oct/18")


blw_expert_viz %>%
  # mutate(mean_perc =  ifelse(perc >= mean(perc), "Above", "Below")) %>%
  ggplot(aes(wave, statements, fill = perc)) +
  geom_tile(alpha = 0.7) +
  ggpubr::theme_pubclean() +
  viridis::scale_fill_viridis(direction = -1, begin = 0.25, option = "B") +
  geom_text(aes(label = round(perc * 100))) +
  scale_x_continuous(breaks = 1:7, labels = survey_dates) +
  labs(y = "", x = "", title = "Ratings of U.S. democratic (non-)performance - Expert perceptions",
       subtitle = "Percentage who answered 'U.S. does not meet this standard'",
       caption = glue::glue("Data: Bright Line Watch expert survey results Wave 1 - 7\nRespondents: {n_experts} Political Scientists at American colleges and universities")) +
  guides(fill = F) +
  theme(strip.background = element_rect(fill = "gray93", color = F),
        legend.position = c(0.935, 0.075),
    plot.title = element_text(size = 14, face = "bold"),
    plot.subtitle = element_text(size = 10, face = "italic"),
    strip.text = element_text(size = 10),
    plot.caption = element_text(size = 10, hjust = 0.9),
    legend.title = element_text(size = 12),
    legend.text = element_text(size = 10),
    legend.key.height = unit(1, unit = "cm"),
    axis.title = element_text(size = 12, face = "bold"),
    panel.spacing = unit(1, "lines"))

ggsave_it(heatmap, width = 8.7, height = 7)
At a first glance, there seems to be widespread agreement on the topic of gerrymandering. Most experts would say that U.S. democracy fails at meeting the standard of fair electoral districts (69% in Oct. 2018). Other issues that many expert respondents pointed out were low voter turnout, equal impact of votes and a common understanding of the facts (49-50% in Oct. 2018).
If we consider the time dimension, we can observe that many ratings stay rather consistent over time.
One change that stands out is from April to July 2018 on the question whether elections are free from foreign influence: a jump from 25 to 44% of experts who said that the U.S. does not meet this standard. This stark increase might be explained by President Trump’s Helsinki summit which happened during the survey was in the field. At the summit, Trump made statements that suggested he believed Putin over the assessment of the U.S. intelligence service when it comes to Russian interference in the U.S. election.
Another interesting jump concerncs the statement that the legislature can limit executive power if need be. A jump from 12% of experts in April to 22% in July and October 2018 say that the U.S. does not meet this standard.
Public Survey
Next, I complete the same procedure for the public survey. But first, some data wrangling:
blw_public <- read_dta(unzip("data/blw_data7", files = "BLW_Public_Waves34567.dta"))

survey_dates_3 <- survey_dates[5:7]

not_na <- function(x) {
  !is.na(x)
}

n_public <- blw_public %>%
  select(wave, weight, perf_misconduct:perf_investigations) %>%
  mutate_all(not_na) %>%
  colSums() %>%
  as.vector() %>%
  sort() %>%
  .[27]


blw_public_viz <- blw_public %>%
  select(wave, weight, perf_misconduct:perf_investigations) %>%
  gather(key, value, -wave, -weight) %>%
  drop_na(value) %>%
  mutate(standard = ifelse(value == 1, "Missing Standard", "Anything Else")) %>%
  count(key, wave, standard, wt = weight) %>%
  group_by(wave, key) %>%
  mutate(total = sum(n)) %>%
  mutate(perc = n / total) %>%
  ungroup()  %>%
  filter(standard == "Missing Standard")  %>%
  mutate(statements = case_when(
    key == "perf_ban_ideology" ~ "All parties allowed",
    key == "perf_candidates_disclose" ~ "Candidates disclose info",
    key == "perf_common_und" ~ "Common understanding of facts",
    key == "perf_compromise" ~ "Compromise sought",
    key == "perf_contributions" ~ "Contribs determine policy",
    key == "perf_districts" ~ "Districts not biased",
    key == "perf_election_fraud" ~ "Fraud-free elections",
    key == "perf_equal_rights" ~ "Equal political/legal rights",
    key == "perf_expand_executive" ~ "Constitution limits executive",
    key == "perf_foreign" ~ "No foreign influence",
    key == "perf_funds_transparent" ~ "Campaign funds transparent",
    key == "perf_investigations" ~ "Investigations not compromised",
    key == "perf_journalists" ~ "No interference with press",
    key == "perf_judicial_ind" ~ "Judicial independence",
    key == "perf_judiciary_check" ~ "Judiciary can limit executive",
    key == "perf_legislature_check" ~ "Legislature can limit executive",
    key == "perf_misconduct" ~ "Sanctions for misconduct",
    key == "perf_monitor_opponents" ~ "Agencies not used against opp.",
    key == "perf_opinions" ~ "Opinions heard on policy",
    key == "perf_participation" ~ "Voter participation",
    key == "perf_patriotism" ~ "Patriotism not questioned",
    key == "perf_private_gain" ~ "No private gains from office",
    key == "perf_private_violence" ~ "No political violence",
    key == "perf_protest" ~ "Protest rights",
    key == "perf_votes_impact" ~ "Votes have equal impact",
    key == "perf_voting_rights" ~ "Equal voting rights",
    key == "perf_free_speech" ~ "Free speech",
    T ~ NA_character_
  )) %>%
  mutate(statements = forcats::fct_reorder(statements, perc))
## Warning: attributes are not identical across measure variables;
## they will be dropped
Now let’s investigate how the public evaluates American democracy:
blw_public_viz %>%
  ggplot(aes(wave, statements, fill = perc)) +
  geom_tile(alpha = 0.7) +
  ggpubr::theme_pubclean() +
  viridis::scale_fill_viridis(direction = -1, begin = 0.35, option = "B") +
  geom_text(aes(label = round(perc * 100))) +
  scale_x_continuous(breaks = 5:7, labels = survey_dates_3) +
  labs(y = "", x = "", title = "Ratings of U.S. democratic (non-)performance - Public perceptions",
       subtitle = "Percentage who answered 'U.S. does not meet this standard'",
       caption = glue::glue("Data: Bright Line Watch expert survey results Wave 5 - 7\nN: {n_public} respondents; nationally representative samples")) +
  guides(fill = F) +
  theme(strip.background = element_rect(fill = "gray93", color = F),
        legend.position = c(0.935, 0.075),
    plot.title = element_text(size = 14, face = "bold"),
    plot.subtitle = element_text(size = 10, face = "italic"),
    strip.text = element_text(size = 10),
    plot.caption = element_text(size = 10, hjust = 0.9),
    legend.title = element_text(size = 12),
    legend.text = element_text(size = 10),
    legend.key.height = unit(1, unit = "cm"),
    axis.title = element_text(size = 12, face = "bold"),
    panel.spacing = unit(1, "lines"))

ggsave_it(heatmap3, width = 8.5, height = 7)
Evaluations of U.S. democratic non-performance by the public remain relatively stable over the three observation points in 2018.
More than half of respondents in the public sample said that the U.S. fails to meet the standard of government officials not misusing public office for private gain (51% in October 2018). A majority of respondents in the nationally representative sample also believe that political opponents are smeared with accusations of disloyalty and a lack of patriotism (53% in October).
Experts + Public
survey_dates <- c("2/17", "5/17", "9/17", "1/18", "4/18", "7/18", "10/18")


blw_public_viz %>%
  mutate(Survey = "Public Sample") %>%
  bind_rows(blw_expert_viz %>%
              mutate(Survey = "Expert Sample")) %>%
  ggplot(aes(wave, perc, color = Survey)) +
  geom_line(alpha = 0.5, size = 0.5) +
  theme_minimal() +
  # viridis::scale_fill_viridis(direction = -1, begin = 0.25, option = "B") +
  ggthemes::scale_color_gdocs() +
  geom_text(aes(label = round(perc * 100)), show.legend  = F) +
  scale_x_continuous(breaks = 1:7, labels = survey_dates) +
  scale_y_continuous(labels = scales::percent_format()) +
  labs(y = "", x = "", title = "Ratings of U.S. democratic (non-)performance - Expert vs. Public perceptions",
       subtitle = "Percentage who answered 'U.S. does not meet this standard'",
       caption = glue::glue("Data: Bright Line Watch expert survey results Wave 1 - 7\nExperts: {n_experts} Political Scientists at American colleges and universities\nPublic: {n_public} respondents; nationally representative samples")) +
  guides(color = guide_legend(override.aes = list(size = 1.5))) +
  facet_wrap(~statements, nrow = 4) +
  theme(strip.background = element_rect(fill = "gray93", color = F),
        legend.position = c(0.935, 0.075),
    plot.title = element_text(size = 18, face = "bold"),
    plot.subtitle = element_text(size = 14, face = "italic"),
    strip.text = element_text(size = 10),
    plot.caption = element_text(size = 10, hjust = 0.9),
    legend.title = element_text(size = 12),
    legend.text = element_text(size = 10),
    legend.key.height = unit(1, unit = "cm"),
    axis.title = element_text(size = 12, face = "bold"),
    panel.spacing = unit(1, "lines"))

ggsave_it(lineplot, width = 16, height = 7)
When we directly compare public and expert evaluations, we can see that the public seems to be somewhat more or at least as skeptical than experts except for questions on adequate voter turnout, equal impact of votes and fair electoral districts. On such issues, experts are more likely to say that the U.S. does not meet this standard than the general public.