Packages and Folders
# Install these packages if you don't have them yet
# if (!require("pacman")) install.packages("pacman")
# devtools::install_github("favstats/tidytemplate")

pacman::p_load(tidyverse, tidytemplate, htmltab,
               janitor, gameofthrones, extrafont,
               scales, ggthemes)

# Creates folders
# tidytemplate::data_dir()
# tidytemplate::images_dir()
Scraping Views from Wikipedia
got_tables <- "https://en.wikipedia.org/wiki/List_of_Game_of_Thrones_episodes"


episode_list <- 2:9 %>%
  map_dfr(~htmltab(got_tables, .x) %>% mutate(season = .x - 1)) %>%
  clean_names() %>%
  mutate_at(vars(no_overall, no_inseason, u_s_viewers_millions), as.numeric) %>%
  mutate(season = str_glue("Season {season}")) %>%
  mutate(written_by = ifelse(str_detect(written_by, "David Benioff & D. B. Weiss"), "David Benioff & D. B. Weiss", written_by))  %>%
  mutate(title = str_remove_all(title, '\\"'))

# ## save data after scraping
save(episode_list, file = "data/episode_list.Rdata")
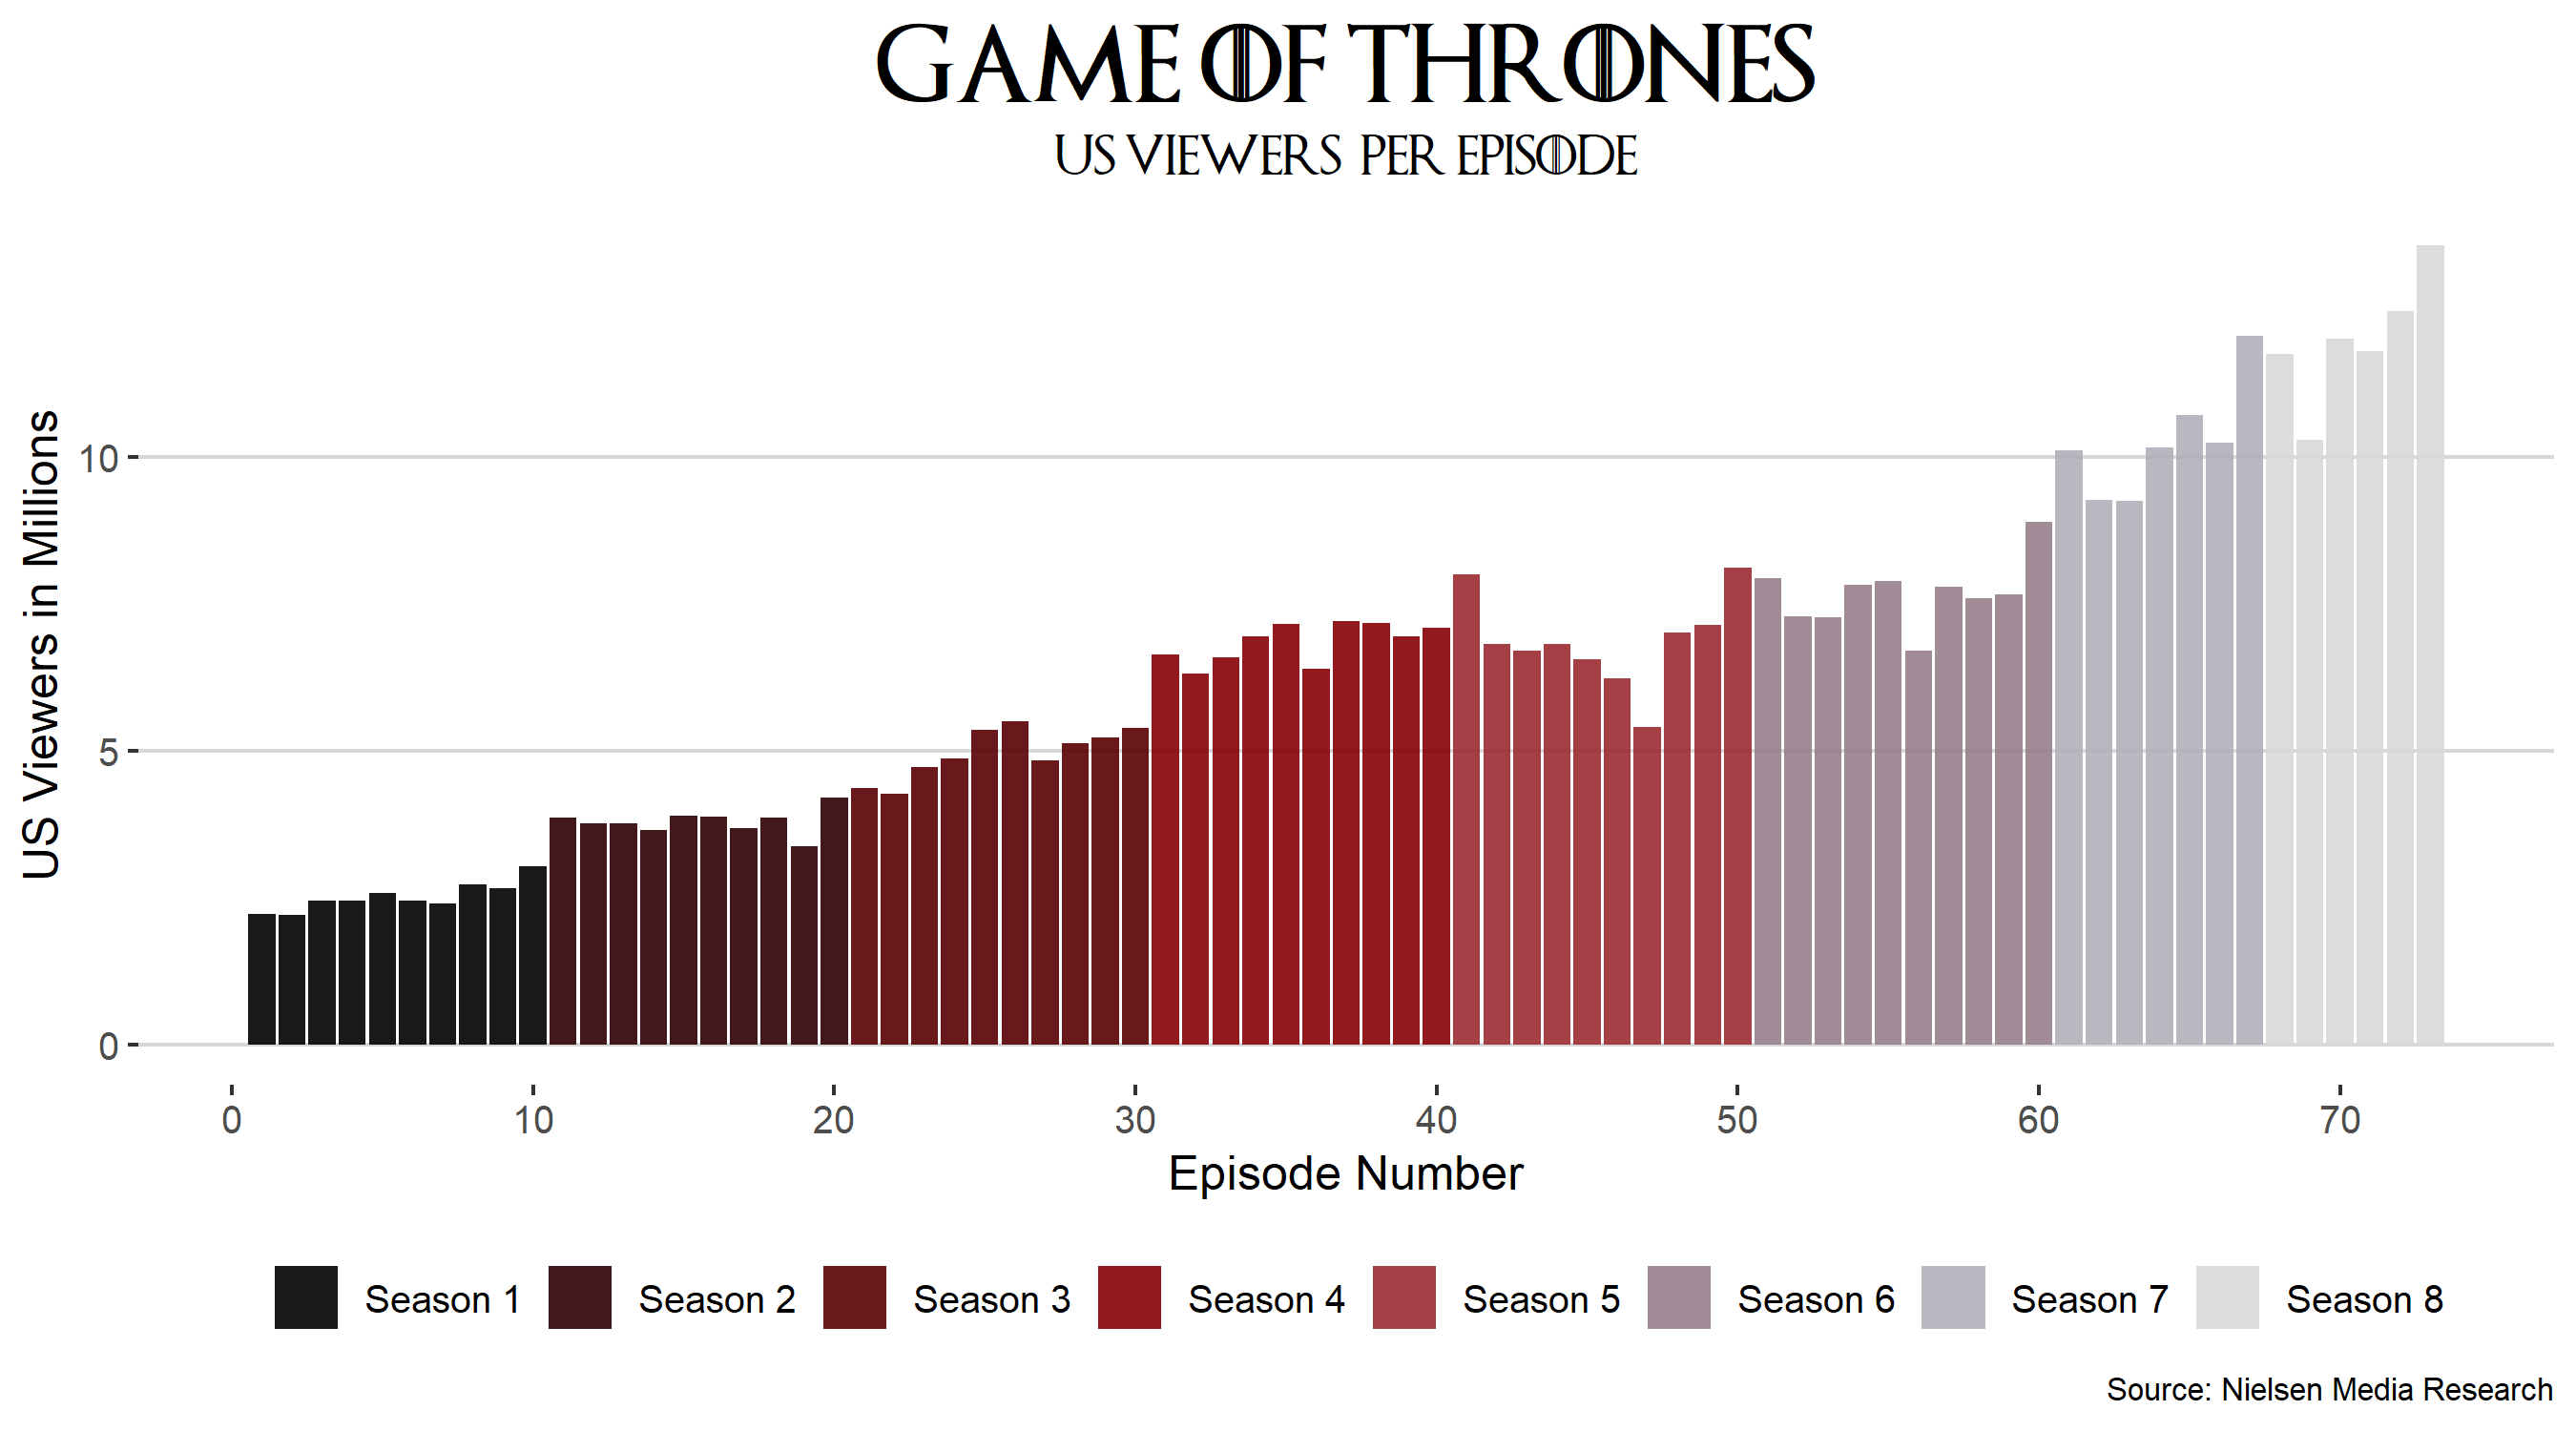
Views over time
episode_list %>%
  ggplot(aes(no_overall, u_s_viewers_millions, fill = season)) +
  geom_col(alpha = 0.9, position = position_dodge(width = 0.1)) +
  ggthemes::theme_hc() +
  scale_fill_got("", discrete = T, option = "Targaryen") +
  scale_x_continuous(breaks = seq(0, 70, 10)) +
  labs(y = "US Viewers in Millions",
       x = "Episode Number",
       title = "Game of Thrones",
       subtitle =  "US viewers  per episode",
       caption = "Source: Nielsen Media Research") +
  guides(fill = guide_legend(nrow = 1)) +
  theme(plot.title = element_text(size = 20, face = "bold", hjust = 0.5, family = "Game of Thrones"),
        plot.subtitle = element_text(size = 10, hjust = 0.5, family = "Game of Thrones"),
        plot.caption = element_text(size = 8))

ggsave_it(season_views, width = 9, height = 5)
How many episodes were written by which writer?
episode_list %>%
  count(written_by, sort = T)
## # A tibble: 5 x 2
##   written_by                      n
##   <chr>                       <int>
## 1 David Benioff & D. B. Weiss    51
## 2 Bryan Cogman                   11
## 3 Dave Hill                       4
## 4 George R. R. Martin             4
## 5 Vanessa Taylor                  3
How many episodes were directed by which director?
episode_list %>%
  count(directed_by, sort = T)
## # A tibble: 20 x 2
##    directed_by                     n
##    <chr>                       <int>
##  1 David Nutter                    9
##  2 Alan Taylor                     7
##  3 Alex Graves                     6
##  4 Jeremy Podeswa                  6
##  5 Mark Mylod                      6
##  6 Miguel Sapochnik                6
##  7 Daniel Minahan                  5
##  8 Alik Sakharov                   4
##  9 Michelle MacLaren               4
## 10 Brian Kirk                      3
## 11 Daniel Sackheim                 2
## 12 David Petrarca                  2
## 13 Jack Bender                     2
## 14 Matt Shakman                    2
## 15 Michael Slovis                  2
## 16 Neil Marshall                   2
## 17 Tim Van Patten                  2
## 18 D. B. Weiss                     1
## 19 David Benioff                   1
## 20 David Benioff & D. B. Weiss     1
Scraping Rotten Tomatoes Ratings
Creating a function to get the ratings
get_rotten_ratings <- function(link) {

  raw_html <- read_html(link)

  rotten_rating <- raw_html %>%
    html_nodes("#scoreStats div:nth-child(1)") %>%
    html_text() %>%
    parse_number()

  rotten_score <-  raw_html %>%
    html_nodes("#tomato_meter_link > span.meter-value.superPageFontColor") %>%
    html_text() %>%
    parse_number()

  final_data <- tibble(rotten_rating, rotten_score)

  return(final_data)

}


episode_ratings <- episode_list %>%
  mutate(season = str_replace(season, "Season ", "s0")) %>%
  mutate(episode = ifelse(nchar(no_inseason) == 1, paste0("e0", no_inseason), paste0("e", no_inseason))) %>%
  mutate(rottenlink = str_glue("https://www.rottentomatoes.com/tv/game_of_thrones/{season}/{episode}")) %>%
  pull(rottenlink) %>%
  map_dfr(get_rotten_ratings) %>%
  bind_cols(episode_list, .)

# ## save data after scraping
save(episode_ratings, file = "data/episode_ratings.Rdata")
Ratings by Writer
episode_ratings %>%
  mutate(written_by = fct_reorder(written_by, rotten_rating)) %>%
  ggplot(aes(written_by, rotten_rating)) +
  geom_jitter(width = 0.3) +
  geom_violin(alpha = 0.75, aes(fill = written_by)) +
  geom_boxplot(width = 0.05) +
  guides(fill = F) +
  ggthemes::theme_hc() +
  scale_fill_got("", discrete = T, option = "Margaery") +
  labs(y = "Rotten Tomatoes Rating", x = "", title = "Game of Thrones", subtitle = "Ratings  by Writer")  +
  theme(plot.title = element_text(size = 20, face = "bold", hjust = 0.5, family = "Game of Thrones"),
        plot.subtitle = element_text(size = 10, hjust = 0.5, family = "Game of Thrones"))

ggsave_it(writer_ratings, width = 9, height = 5)
Scores by Writer
episode_ratings %>%
  mutate(written_by = fct_reorder(written_by, rotten_score)) %>%
  ggplot(aes(written_by, rotten_score)) +
  geom_jitter(width = 0.3) +
  geom_violin(alpha = 0.75, aes(fill = written_by)) +
  geom_boxplot(width = 0.05) +
  guides(fill = F) +
  ggthemes::theme_hc() +
  scale_fill_got("", discrete = T, option = "Margaery") +
  labs(y = "Rotten Tomatoes Scores", x = "", title = "Game of Thrones", subtitle = "Episode  Scores  by Writer")  +
  theme(plot.title = element_text(size = 20, face = "bold", hjust = 0.5, family = "Game of Thrones"),
        plot.subtitle = element_text(size = 10, hjust = 0.5, family = "Game of Thrones"))

ggsave_it(writer_scores, width = 9, height = 5)
Rating by Director
episode_ratings %>%
  mutate(directed_by = fct_reorder(directed_by, rotten_rating)) %>%
  ggplot(aes(directed_by, rotten_rating)) +
  geom_jitter(width = 0.3) +
  geom_violin(alpha = 0.75, aes(fill = directed_by)) +
  geom_boxplot(width = 0.05) +
  guides(fill = F) +
  ggthemes::theme_hc() +
  scale_fill_got("", discrete = T, option = "Stark2") +
  labs(y = "Rotten Tomatoes Rating", x = "", title = "Game of Thrones", subtitle = "Ratings  by Director")  +
  theme(plot.title = element_text(size = 20, face = "bold", hjust = 0.5, family = "Game of Thrones"),
        plot.subtitle = element_text(size = 10, hjust = 0.5, family = "Game of Thrones")) +
  coord_flip()

ggsave_it(director_ratings, width = 6, height = 12)
Scores by Director
episode_ratings %>%
  mutate(directed_by = fct_reorder(directed_by, rotten_score)) %>%
  ggplot(aes(directed_by, rotten_score)) +
  geom_jitter(width = 0.3) +
  geom_violin(alpha = 0.75, aes(fill = directed_by)) +
  geom_boxplot(width = 0.05) +
  guides(fill = F) +
  ggthemes::theme_hc() +
  scale_fill_got("", discrete = T, option = "Stark2") +
  labs(y = "Rotten Tomatoes Rating", x = "", title = "Game of Thrones", subtitle = "Scores  by Director")  +
  theme(plot.title = element_text(size = 20, face = "bold", hjust = 0.5, family = "Game of Thrones"),
        plot.subtitle = element_text(size = 10, hjust = 0.5, family = "Game of Thrones")) +
  coord_flip()

ggsave_it(director_scores, width = 6, height = 12)
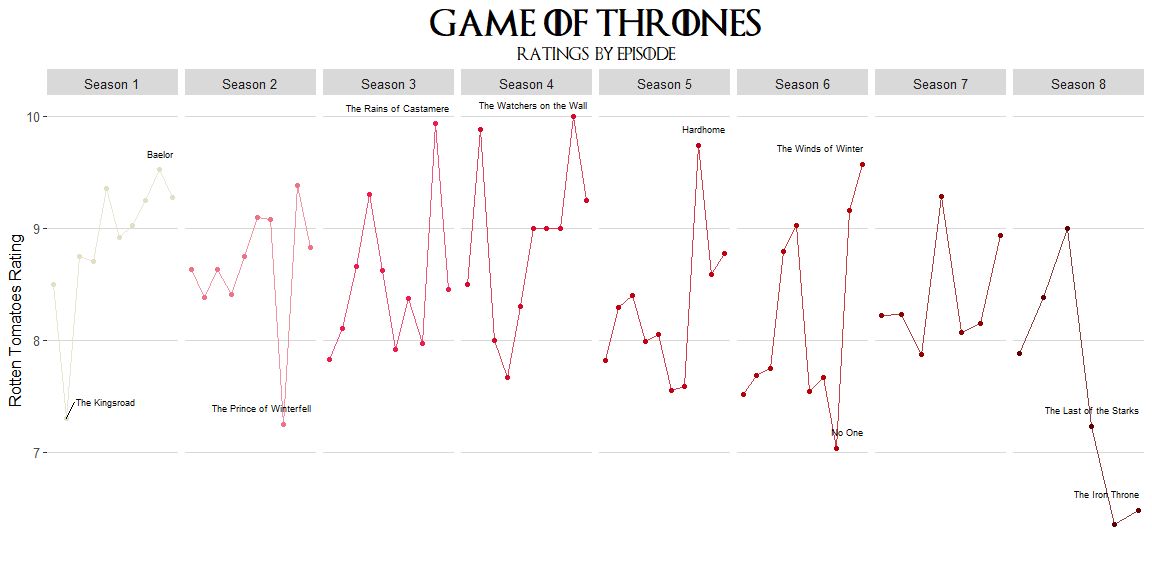
Rating by Episode
episode_titles <- episode_ratings %>%
  filter(rotten_rating > 9.4 | rotten_rating < 7.5) %>%
  filter(title != "The Lion and the Rose") %>%
  filter(title != "The Bells")

episode_ratings %>%
  ggplot(aes(no_overall, rotten_rating, color = season)) +
  geom_point() +
  geom_line(alpha = 0.75) +
  ggrepel::geom_text_repel(data = episode_titles, aes(label = title),
                           size = 2.5, nudge_y = 0.15, nudge_x = 3, seed = 200, color = "black") +
  facet_wrap(~season, scales = "free_x", nrow = 1)  +
  ggthemes::theme_hc() +
  scale_color_got("", discrete = T, option = "Targaryen2") +
  labs(y = "Rotten Tomatoes Rating", x = "", title = "Game of Thrones", subtitle = "Ratings  by Episode")  +
  theme(plot.title = element_text(size = 20, face = "bold", hjust = 0.5, family = "Game of Thrones"),
        plot.subtitle = element_text(size = 10, hjust = 0.5, family = "Game of Thrones")) +
  guides(color = F)  +
  theme(axis.text.x = element_blank(),
        axis.ticks.x = element_blank())
ggsave_it(episode_ratings, width = 12, height = 6)
Score by Episode
episode_titles <- episode_ratings %>%
  filter(rotten_score < 80) %>%
  filter(title != "The Lion and the Rose") %>%
  filter(title != "The Bells")

episode_ratings %>%
  ggplot(aes(no_overall, rotten_score, color = season)) +
  geom_point() +
  geom_line(alpha = 0.75) +
  ggrepel::geom_text_repel(data = episode_titles, aes(label = title),
                           size = 2.5, nudge_y = 2, nudge_x = 5, seed = 200, color = "black") +
  facet_wrap(~season, scales = "free_x", nrow = 1)  +
  ggthemes::theme_hc() +
  scale_color_got("", discrete = T, option = "Greyjoy") +
  labs(y = "Rotten Tomatoes Score", x = "", title = "Game of Thrones", subtitle = "Scores  by Episode")  +
  theme(plot.title = element_text(size = 20, face = "bold", hjust = 0.5, family = "Game of Thrones"),
        plot.subtitle = element_text(size = 10, hjust = 0.5, family = "Game of Thrones")) +
  guides(color = F)  +
  theme(axis.text.x = element_blank(),
        axis.ticks.x = element_blank())

ggsave_it(rotten_score, width = 12, height = 6)