Data Sources:
Load packages
pacman::p_load(tidyverse, tabulizer, gganimate)
Get Acceptance Rates
source("asylum_dat.R")

load("data/refugee_decisions.Rdata")
Number of Refugees Data
load("data/asylum_dat.Rdata")

asylum_dat <- asylum_dat %>%
  full_join(refugee_decisions) %>%
  select(time, `Total Number of Asylum Seekers` = number,
         `Accepted Applications` = pos,
         `Declined Applications` = neg) %>%
  gather(key, number, -time)
Plot Static
rev_cols <- c("#56B4E9", "#E69F00", "#000000")
#rev(ggthemes::colorblind_pal()(3))
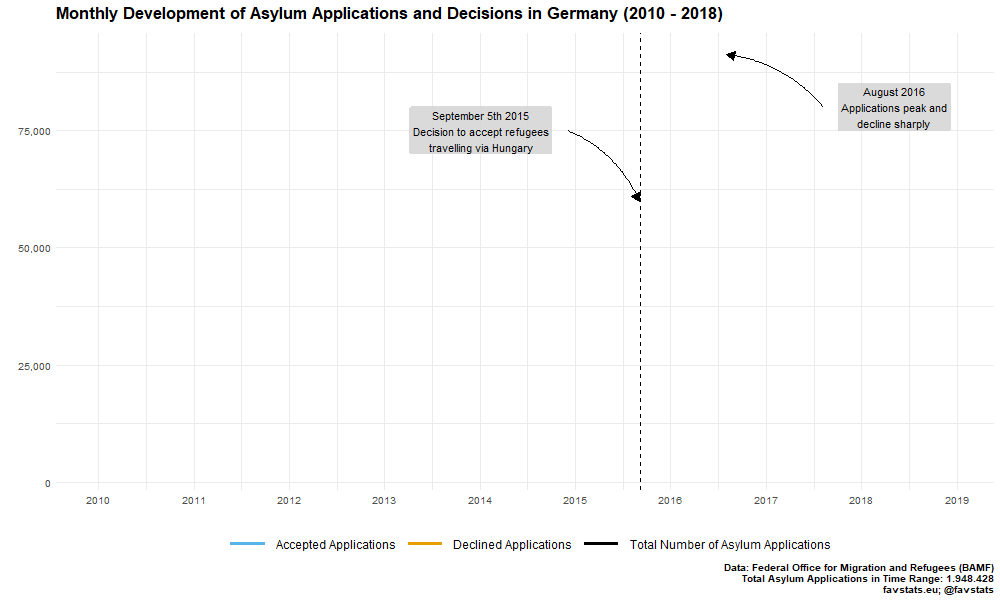
n_peak <- asylum_dat %>%
filter(time == as.Date("2016-08-01")) %>%
filter(key == "Total Number of Asylum Seekers") %>%
.$number
asylum_dat %>%
ggplot(aes(time, number)) +
geom_line(aes(color = key), size = 1.1) +
ggtitle("Monthly Development of Asylum Applications and Decisions in Germany (2010 - 2018)\n") +
xlab("") +
ylab("") +
labs(caption = "Data: Federal Office for Migration and Refugees (BAMF)\nTotal Asylum Seekers in Time Range: 1.948.428\nfavstats.eu; @favstats") +
theme_minimal() +
scale_color_manual("", values = rev_cols) +
geom_vline(xintercept = as.numeric(as.Date("2015-09-05")), linetype = "dashed") +
## Open Door Policy
annotate("label", as.Date("2014-01-05"), y = 75000,
fill = "lightgrey", alpha = 0.85, label.size = NA,
label = "September 5th 2015\nDecision to accept refugees\ntravelling via Hungary") +
geom_curve(aes(x = as.Date("2014-12-05"), y = 75000,
xend = as.Date("2015-09-03"), yend = 60000),
arrow = arrow(length = unit(0.02, "npc"), type = "closed"), curvature = -0.2) +
## Peak
annotate("label", as.Date("2018-05-07"), y = 80000,
fill = "lightgrey", alpha = 0.85, label.size = NA,
label = "August 2016\nApplications peak and\ndecline sharply") +
geom_curve(aes(x = as.Date("2017-08-07"), y = 80000,
xend = as.Date("2016-08-01"), yend = n_peak),
arrow = arrow(length = unit(0.02, "npc"), type = "closed"), curvature = 0.2) +
# geom_vline(xintercept = as.numeric(as.Date("2016-03-09")), linetype=4) +
# geom_vline(xintercept = as.numeric(as.Date("2016-03-20")), linetype=4) +
scale_y_continuous(labels = scales::comma) +
scale_x_date(breaks = scales::date_breaks("1 year"),
labels = scales::date_format("%Y"), limits = c(as.Date("2010-01-01"),
as.Date("2018-12-12"))) +
theme(legend.position = "bottom",
legend.key.width = unit(3, "line"),
legend.key.size = unit(1.2, "line"),
legend.text = element_text(size = 12),
axis.text = element_text(size = 10),
title = element_text(size = 14, face = "bold"),
plot.caption = element_text(size = 10),
axis.title = element_text(size = 10))
ggsave(filename = "images/asylum_numbers.png", width = 12, height = 7)

Logged Numbers
rev_cols <- c("#56B4E9", "#E69F00", "#000000")
#rev(ggthemes::colorblind_pal()(3))

n_peak <- asylum_dat %>%
  filter(time == as.Date("2016-08-01")) %>%
  filter(key == "Total Number of Asylum Applications") %>%
  .$number


asylum_dat %>%
  ggplot(aes(time, number)) +
  geom_line(aes(color = key), size = 1.1) +
  ggtitle("Monthly Development of Asylum Applications and Decisions in Germany (2010 - 2018)\n") +
  xlab("") +
  ylab("Logged Number of Applications/Decisions") +
  labs(caption = "Data: Federal Office for Migration and Refugees (BAMF)\nTotal Asylum Applications in Time Range: 1.948.428\nfavstats.eu; @favstats") +
  theme_minimal() +
  scale_color_manual("", values = rev_cols) +
  geom_vline(xintercept = as.numeric(as.Date("2015-09-05")), linetype = "dashed") +
  ## Open Door Policy
  annotate("label", as.Date("2014-01-05"), y = 75000,
           fill = "lightgrey", alpha = 0.85, label.size = NA,
           label = "September 5th 2015\nDecision to accept refugees\ntravelling via Hungary") +
  geom_curve(aes(x = as.Date("2014-12-05"), y = 75000,
                 xend = as.Date("2015-09-03"), yend = 60000),
  arrow = arrow(length = unit(0.02, "npc"), type = "closed"), curvature = -0.2) +
  ## Peak
  annotate("label", as.Date("2018-05-07"), y = 80000,
           fill = "lightgrey", alpha = 0.85, label.size = NA,
           label = "August 2016\nApplications peak and\ndecline sharply") +
  geom_curve(aes(x = as.Date("2017-08-07"), y = 80000,
                 xend = as.Date("2016-08-01"), yend = n_peak),
  arrow = arrow(length = unit(0.02, "npc"), type = "closed"), curvature = 0.2) +
  annotate("label", as.Date("2017-03-07"), y = 3500,
           fill = "lightgrey", alpha = 0.85, label.size = NA,
           label = "March 2016\nClosure of Balkan Route and\nEU - Turkey Refugee Deal") +
  geom_curve(aes(x = as.Date("2017-03-07"), y = 4500,
                 xend = as.Date("2016-03-09"), yend = 6000),
  arrow = arrow(length = unit(0.02, "npc"), type = "closed"), curvature = 0.4) +
  geom_vline(xintercept = as.numeric(as.Date("2016-03-09")), linetype=4) +
  # geom_vline(xintercept = as.numeric(as.Date("2016-03-20")), linetype=4) +
  scale_y_log10(labels = scales::comma) +
  scale_x_date(breaks = scales::date_breaks("1 year"),
               labels = scales::date_format("%Y"), limits = c(as.Date("2010-01-01"),
                                                              as.Date("2018-12-12"))) +
  theme(legend.position = "bottom",
        legend.key.width = unit(3, "line"),
        legend.key.size = unit(1.2, "line"),
        legend.text = element_text(size = 12),
        axis.text = element_text(size = 10),
        title = element_text(size = 14, face = "bold"),
        plot.caption = element_text(size = 10),
        axis.title = element_text(size = 10))


ggsave(filename = "images/asylum_numbers_logged.png", width = 12, height = 7)

Animation
asyl_anim <- asylum_dat %>%
  full_join(refugee_decisions) %>%
  select(time, `Total Number of Asylum Seekers` = number,
         `Accepted Applications` = pos,
         `Declined Applications` = neg) %>%
  gather(key, number, -time) %>%
  ggplot(aes(time, number)) +
  geom_line(aes(color = key), size = 1.1) +
  ggtitle("Monthly Development of Asylum Applications and Decisions in Germany (2010 - 2018)\n") +
  xlab("") +
  ylab("") +
  labs(caption = "Data: Federal Office for Migration and Refugees (BAMF)\nTotal Asylum Seekers in Time Range: 1.948.428\nfavstats.eu; @favstats") +
  theme_minimal() +
  scale_color_manual("", values = rev_cols) +
  geom_vline(xintercept = as.numeric(as.Date("2015-09-05")), linetype = "dashed") +
  ## Open Door Policy
  annotate("label", as.Date("2014-01-05"), y = 75000,
           fill = "lightgrey", alpha = 0.85, label.size = NA,
           label = "September 5th 2015\nDecision to accept refugees\ntravelling via Hungary") +
  geom_curve(aes(x = as.Date("2014-12-05"), y = 75000,
                 xend = as.Date("2015-09-03"), yend = 60000),
  arrow = arrow(length = unit(0.02, "npc"), type = "closed"), curvature = -0.2) +
  ## Peak
  annotate("label", as.Date("2018-05-07"), y = 80000,
           fill = "lightgrey", alpha = 0.85, label.size = NA,
           label = "August 2016\nApplications peak and\ndecline sharply") +
  geom_curve(aes(x = as.Date("2017-08-07"), y = 80000,
                 xend = as.Date("2016-08-01"), yend = n_peak),
  arrow = arrow(length = unit(0.02, "npc"), type = "closed"), curvature = 0.2) +
  # geom_vline(xintercept = as.numeric(as.Date("2016-03-09")), linetype=4) +
  # geom_vline(xintercept = as.numeric(as.Date("2016-03-20")), linetype=4) +
  scale_y_continuous(labels = scales::comma) +
  scale_x_date(breaks = scales::date_breaks("1 year"),
               labels = scales::date_format("%Y"), limits = c(as.Date("2010-01-01"),
                                                              as.Date("2018-12-12"))) +
  theme(legend.position = "bottom",
        legend.key.width = unit(3, "line"),
        legend.key.size = unit(1.2, "line"),
        legend.text = element_text(size = 12),
        axis.text = element_text(size = 10),
        title = element_text(size = 14, face = "bold"),
        plot.caption = element_text(size = 10),
        axis.title= element_text(size = 10)) +
  transition_reveal(key, time)

asyl_anim %>% animate(
  nframes = 500, fps = 20, width = 1000, height = 600, detail = 1
)

anim_save("images/asyl_anim.gif")