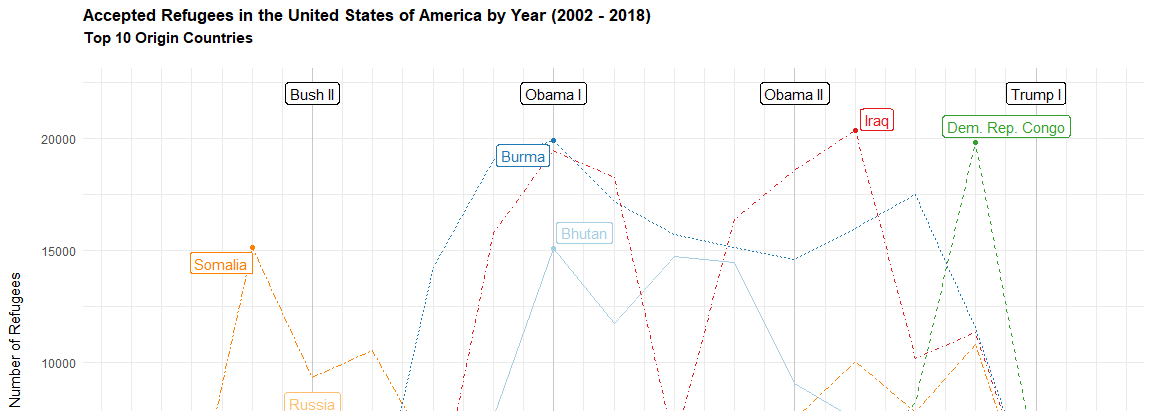
A short script visualizing the number of accepted refugees in the US.
Posts
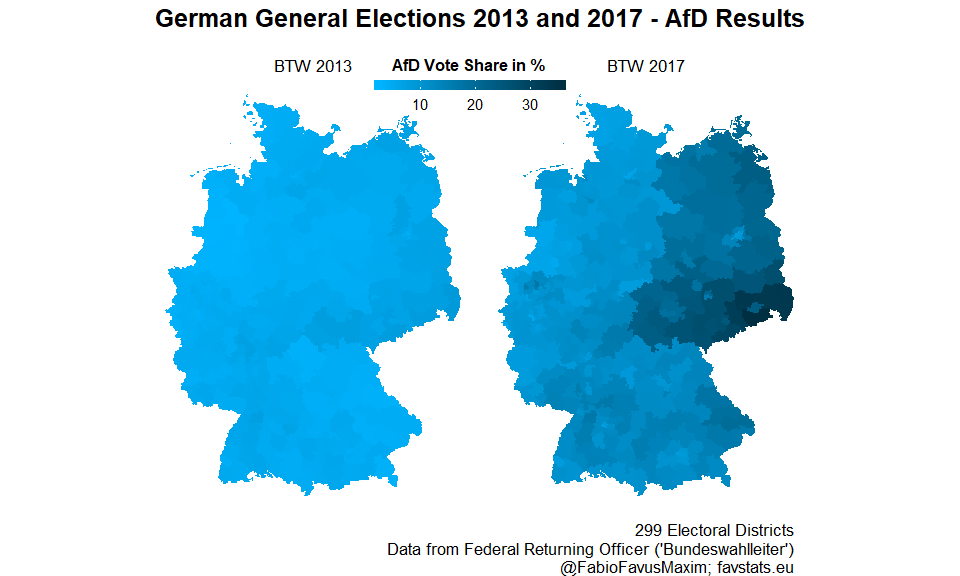
Visualizing Results of German Elections (2013 and 2017)
I recently got my hands on some German election data and here I play around with it a little bit.
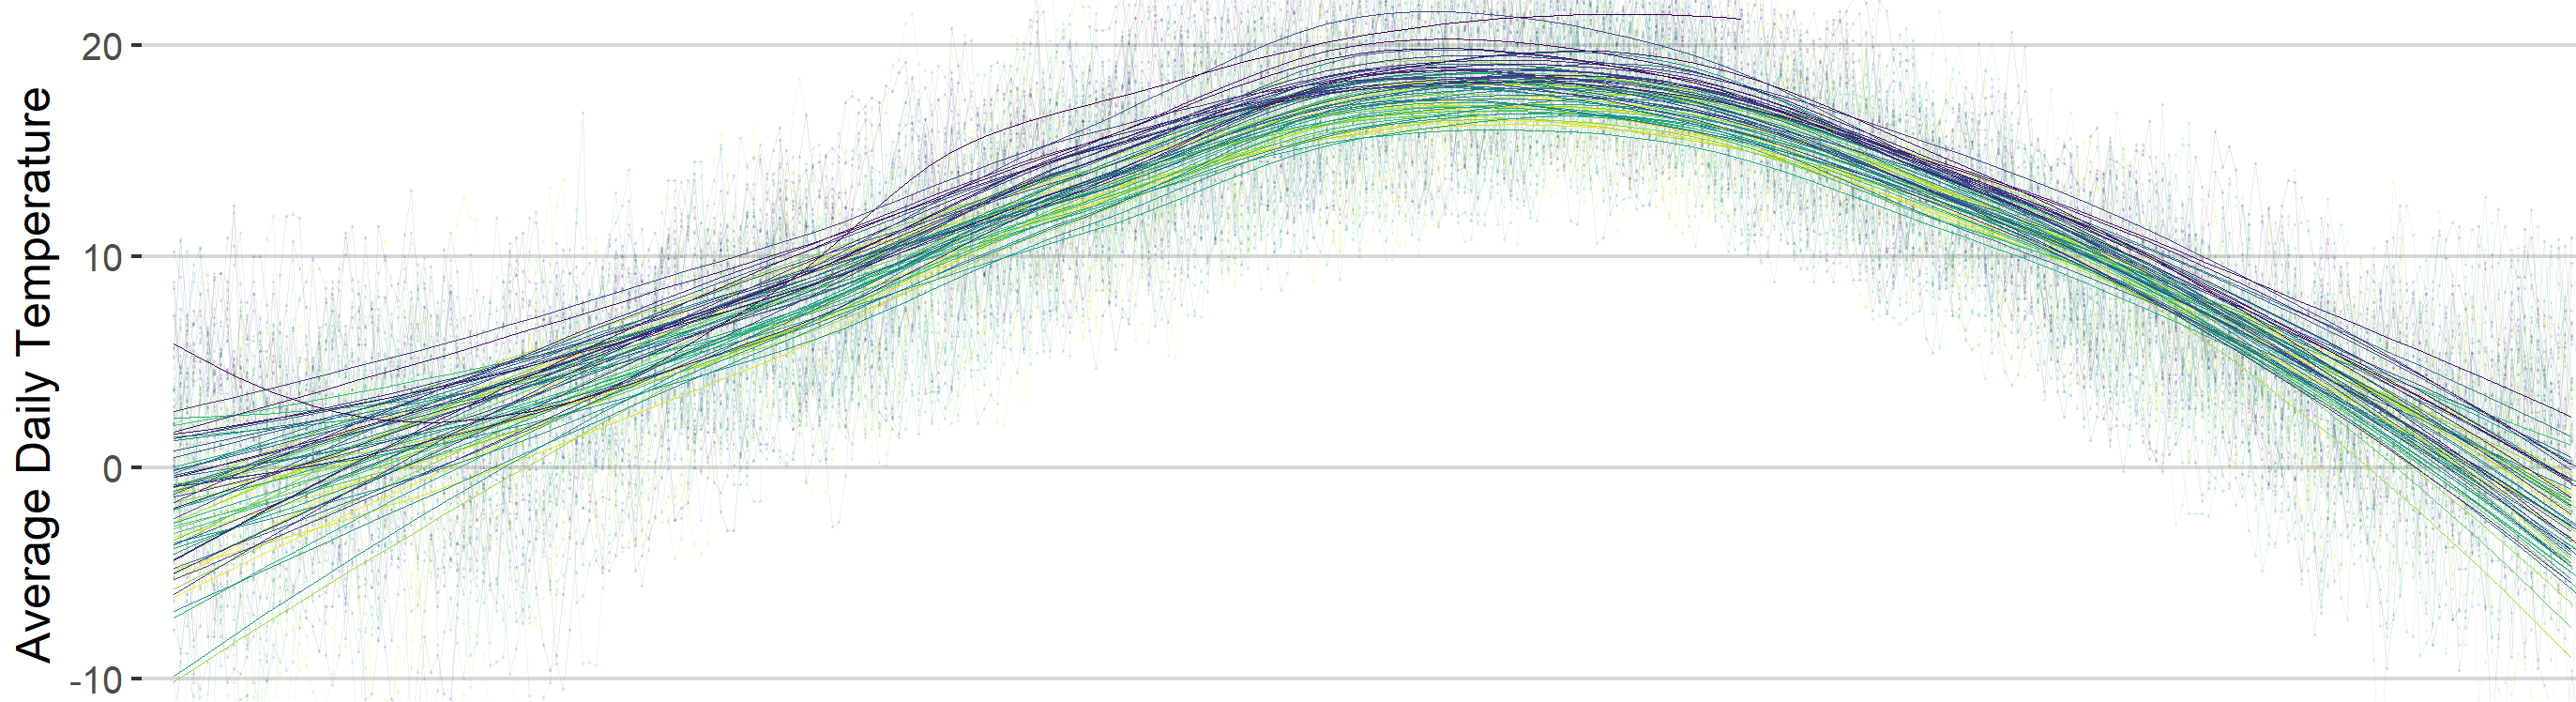
Visualizing Temperature Rise in Stuttgart, Germany over Time
Just a quick use-case of gganimate to visualize the rise of average temperature in my home town.
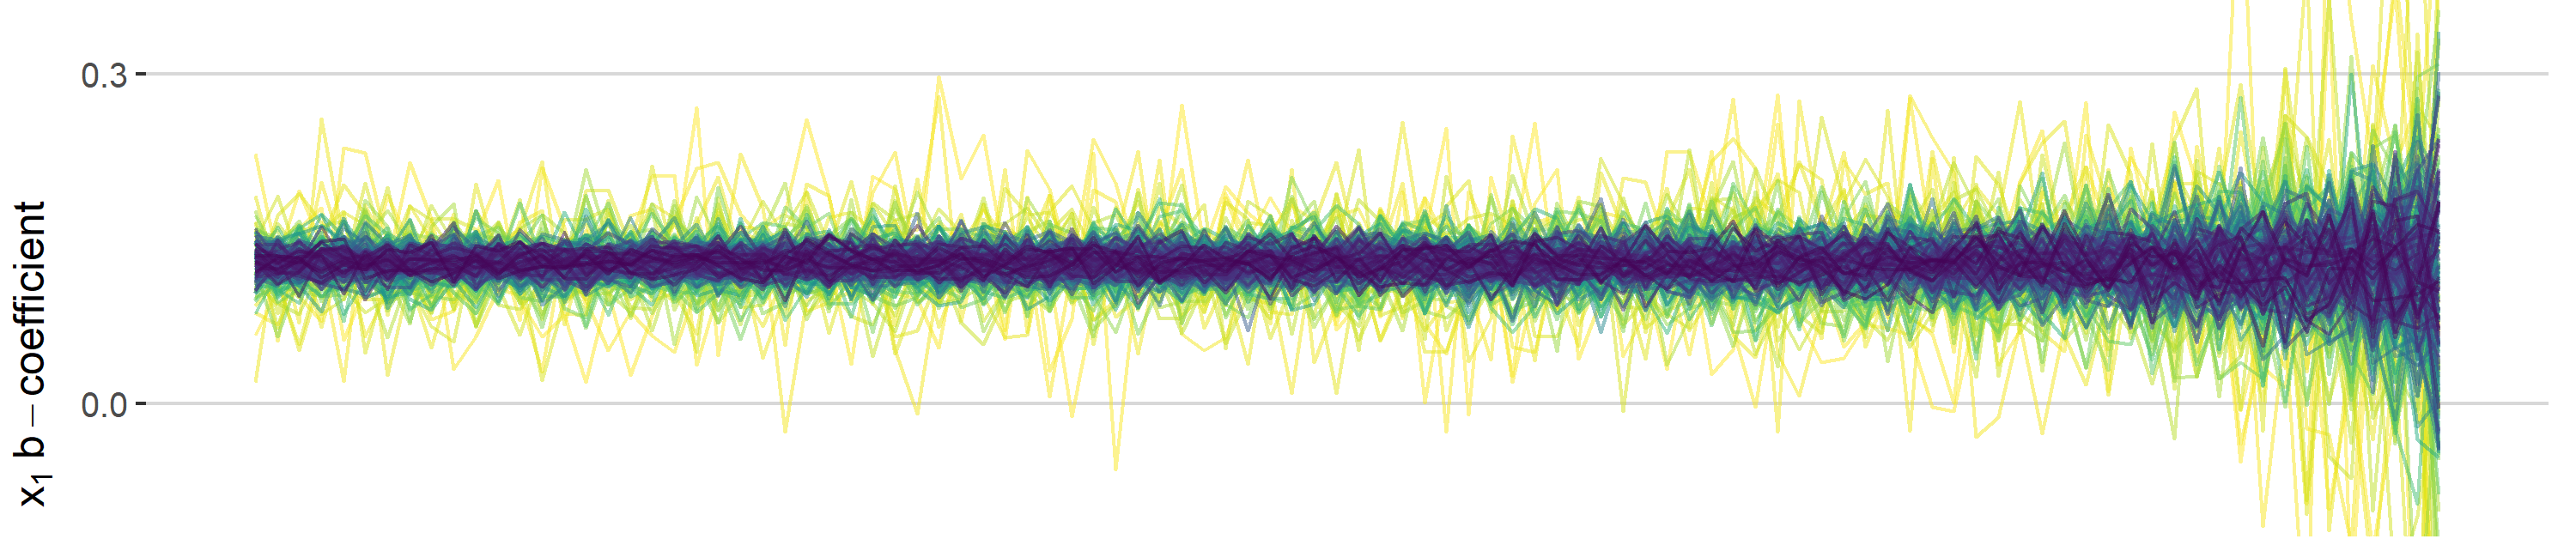
How does Collinearity Influence Linear Regressions?
This is a little simulation where I try to visualize the impact of collinearity on linear regressions.
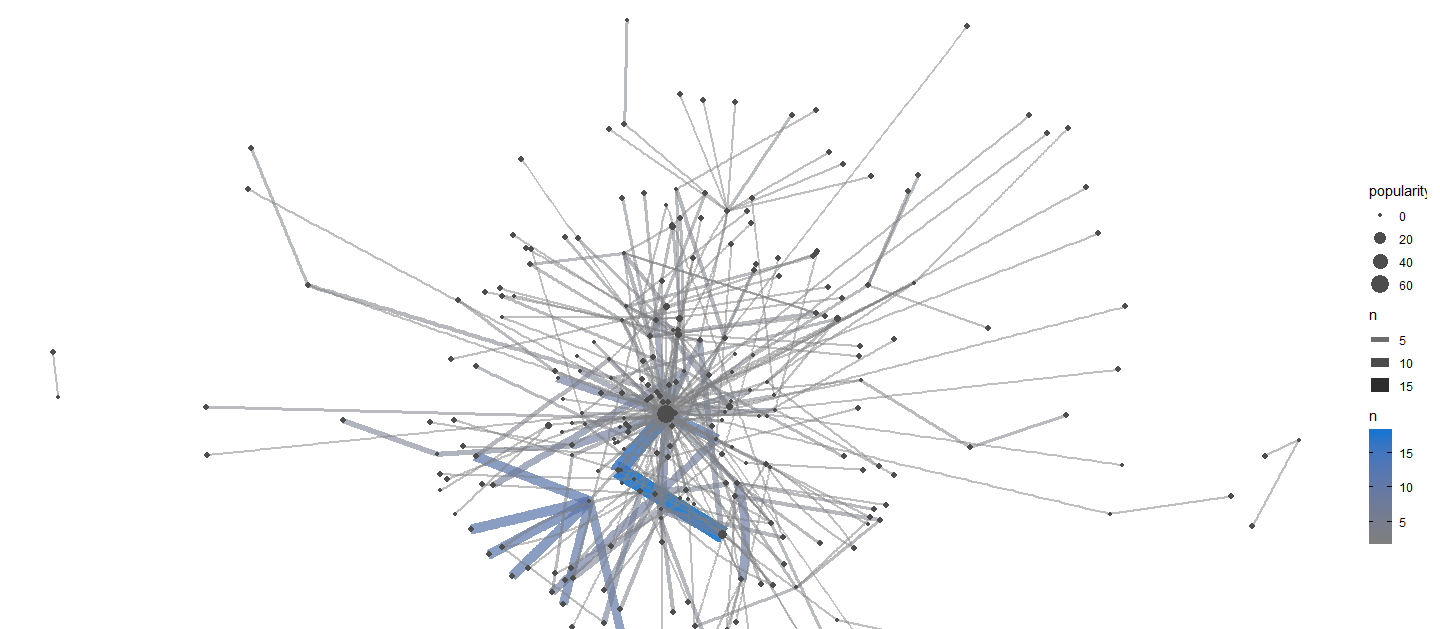
Analyzing Tweets of the ECPR General Conference 2018
In this blogpost I anaylize over 1200 tweets made during the ECPR General Conference 2018 in Hamburg
Mapping Terror Attacks with Highcharter
A short blogpost about creating an interactive map with Highcharter
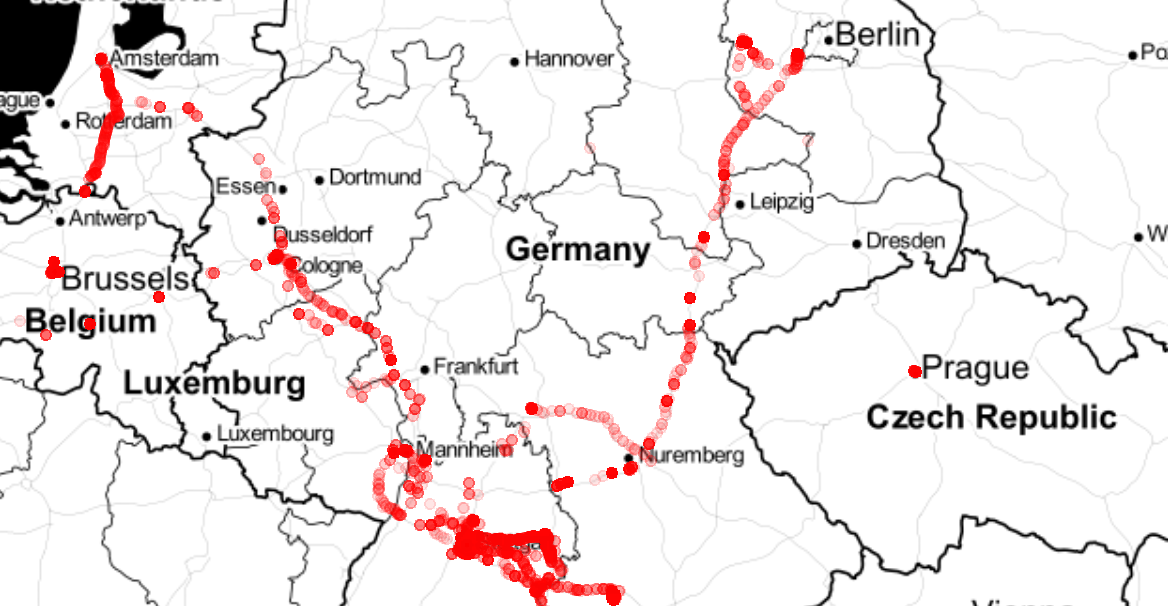
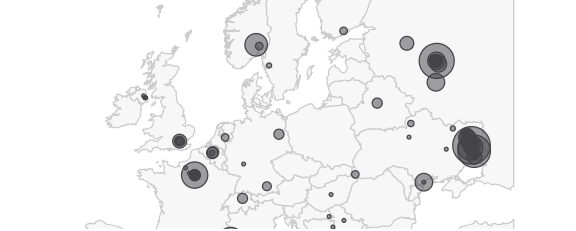
Mapping your 2017 Geolocations: The Tidy Way
A short blogpost about creating a map of your geolocations using Google Data

What do Arab Muslims think about ISIS (Daesh)?
Here I want to dive a little bit into how Arab Muslims see Daesh (a term for ISIS often used by Arabic speakers). The data I will be using is from the Arab Barometer Wave 4, released just a few weeks ago.
Exploring U.S. Refugee Data A Short History of Refugees in the U.S. The United States has a long history of accepting refugees fleeing war, violence or persecution. From the aftermath of World War II to wars in Asia and the collapse of the Soviet bloc, there has not been a shortage of people seeking to escape dire conditions and applying for refugee status in the United States. According to State Department data, more than 3.